The Biogram: Your Unique Blueprint for Human Behavior
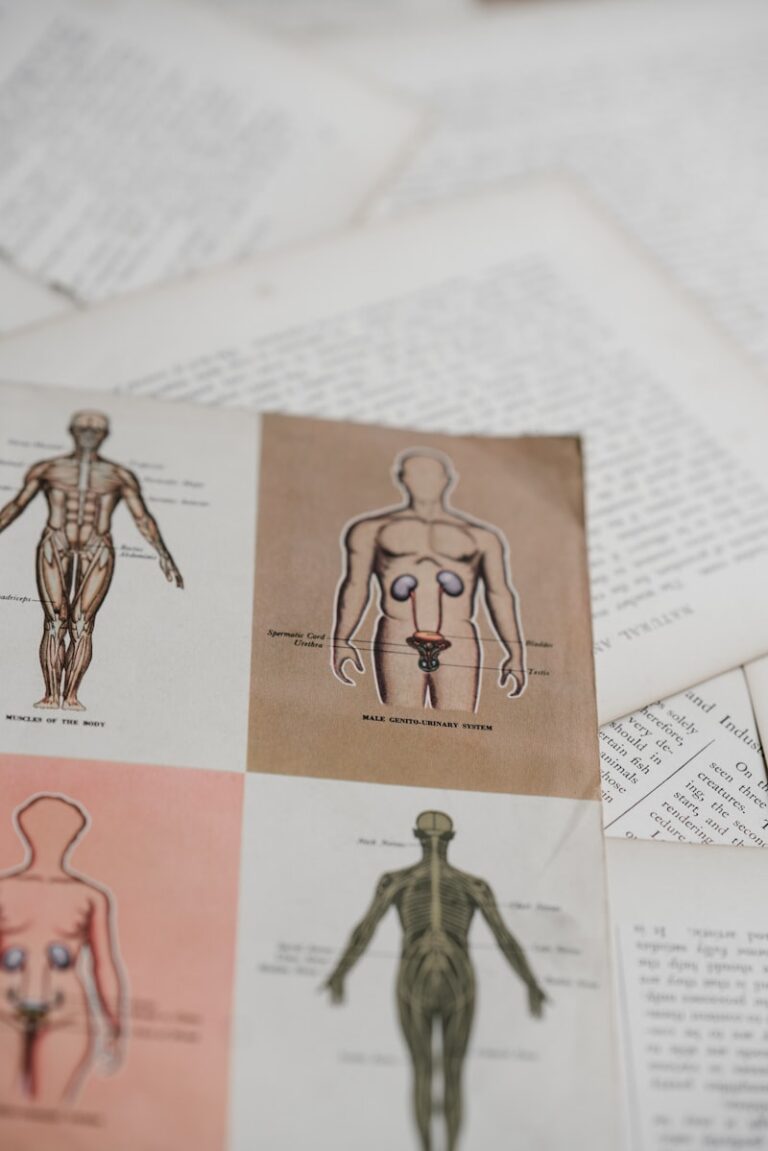
The Biogram: An Integrated Psychobiological Blueprint The Core Definition of a Biogram The term Biogram in psychology refers to an individual’s unique and integrated profile of biological predispositions and psychological patterns that collectively shape their temperament, personality, cognitive style, and overall behavioral tendencies. It represents a comprehensive blueprint, dynamically influenced by both inherent genetic and […]
SCATTERPLOT
Scatterplots are a powerful tool for data visualization and analysis. They are used to display relationships between two or more variables and can be used to identify correlations, trends, and patterns. Scatterplots are a popular choice for data analysis due to their ability to quickly reveal relationships and trends that may not be clear in […]
BAR DISPLAY
Foundations and Conceptual Framework of the Bar Display The bar display, frequently referred to as a bar chart or bar graph, constitutes one of the most fundamental and enduring tools in the arsenal of data visualization. At its core, a bar display is a graphical representation of data that utilizes rectangular bars with lengths proportional […]
SCATTER
SCATTER PLOTS: A COMPREHENSIVE OVERVIEW Scatter plots, often simply termed “scatter diagrams” or “scattergrams,” represent one of the most fundamental and effective graphical techniques available for data visualization and preliminary statistical exploration. They provide an immediate, intuitive representation of the relationship, or lack thereof, between two distinct quantitative variables. These visualizations are indispensable tools across […]