
Frequency Tables: Mapping Patterns in Human Behavior
Introduction and Definition of the Frequency Table A frequency table constitutes a fundamental organizational tool within descriptive statistics, serving as a systematic method for summarizing the distribution of data. At its core, a frequency table is defined as a numerical summary that meticulously records the frequency of occurrences for specific values or ranges of values […]
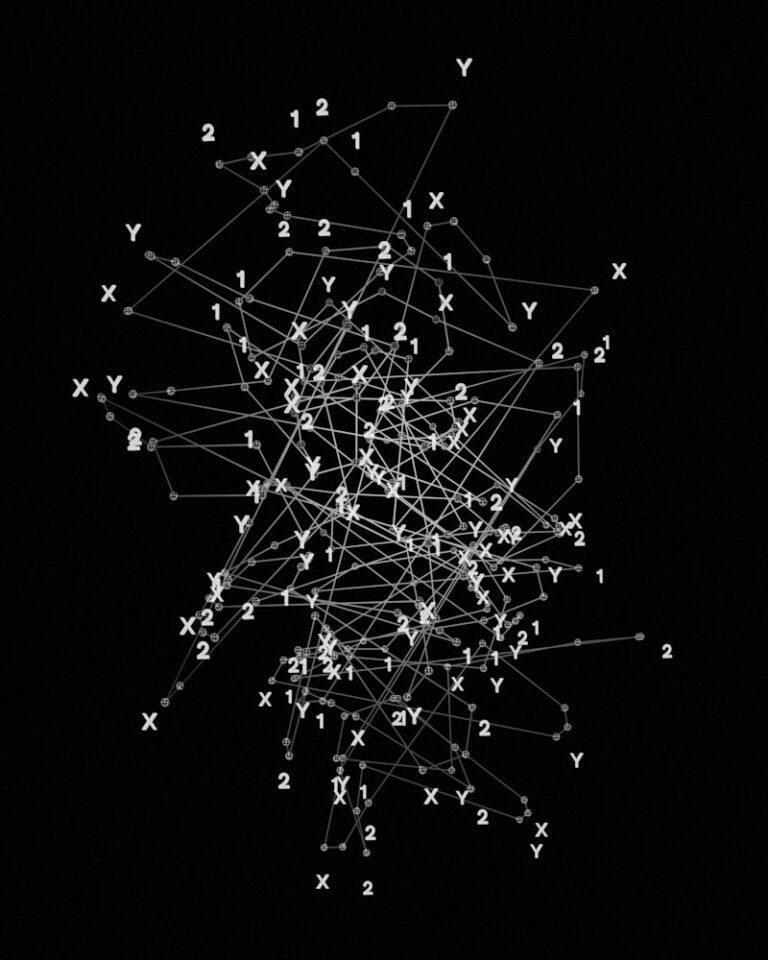
Kruskal-Shepard Scaling: Mapping the Mind’s Proximity
Introduction to Kruskal-Shepard Scaling Kruskal-Shepard Scaling (KSS) is a highly influential technique within the field of psychometrics and data analysis, serving as a primary method of non-metric Multidimensional Scaling (MDS). It is fundamentally concerned with visualizing the underlying structure of proximity data, specifically judgments of similarity or dissimilarity between a set of stimuli or items. […]
Sample Distribution: Decoding Human Data Patterns
Introduction to Sample Distribution The concept of the sample distribution is fundamental to the fields of statistical analysis and psychological research, serving as the empirical foundation upon which all statistical inferences are built. A sample distribution is formally defined as the allocation of observed scores or results derived from a specific subset, known as the […]

Object Display: Visualizing Data for Optimal Cognition
Definition and Core Principles of Object Display Object display, frequently referred to synonymously in human factors literature as a configural display, represents a highly sophisticated methodology of data visualization wherein multiple, disparate data variables are integrated and presented within a single, unified visual form. This approach contrasts fundamentally with traditional analytic displays that necessitate the […]

Frequency Distribution: Making Sense of Psychological Data
FREQUENCY DISTRIBUTION The concept of the frequency distribution serves as a cornerstone in statistical analysis, particularly within the field of psychology, providing the initial, organized structure necessary for interpreting raw data sets. Fundamentally, a frequency distribution is the systematic arrangement of a set of scores or observations, typically ordered from the lowest value to the […]

Smallest Space Analysis: Mapping the Mind’s Structure
Introduction and Fundamental Definition Smallest Space Analysis (SSA) is a powerful and highly specialized technique within the family of multivariate statistical methods, designed primarily for the analysis of complex matrix data. At its core, Smallest Space Analysis functions as a non-metric form of Multidimensional Scaling (MDS), seeking to represent the relationships between a set of […]

Absolute Limits: Decoding Ambiguity in Psychophysics
Introduction to the Acronym AL: Ambiguity in Psychological Terminology The abbreviation AL frequently appears within psychological literature, presenting a dual significance that necessitates careful contextual interpretation. Primarily, AL serves as an abbreviated notation for two fundamentally important, yet distinct, concepts: the Absolute Limit, rooted deeply in the field of psychophysics and sensory thresholds, and the […]

Data Visualization: Why Your Brain Loves the Pie Chart
Definition and Fundamental Principles The Pie Chart is a ubiquitous form of graphic display utilized extensively across statistics, business analytics, and various fields of scientific research, including psychology, for visualizing data that represents a categorical breakdown of a whole. Fundamentally, it is a circular statistical graphic, divided into sectors, or “pie-like wedges,” where the arc […]

Data Smoothing: Unmasking Hidden Patterns in Human Behavior
SMOOTHING Smoothing is a fundamental quantitative technique employed across various scientific disciplines, particularly within psychology, statistics, and data science, aimed at reducing the inherent noise or high-frequency irregularities present in empirical data sets or plotted time series curves. Fundamentally, the process seeks to identify and emphasize the underlying, long-term trends or patterns that might otherwise […]

Correlation Matrices: Unlocking Patterns in Human Behavior
The Correlation Matrix in Psychological Research The Core Definition and Structure The correlation matrix stands as a fundamental statistical tool within psychological research, providing a concise and comprehensive summary of the linear relationships among a set of measured variables. It is defined formally as a symmetric, square matrix that displays the magnitude and direction of […]
Symmetrical Distribution: The Blueprint of Balanced Data
Symmetrical Distribution The Core Definition of Symmetrical Distribution A symmetrical distribution is a fundamental concept in statistics and psychological research, defining a data set where the values are equally distributed around a central point. In simplest terms, if a distribution is graphed, and a vertical line is drawn through its center, the resulting shape on […]

Frequency Distribution: Mapping the Patterns of Human Mind
The Frequency Curve in Psychological Statistics The Core Definition and Statistical Foundation The frequency curve is a specialized graphical tool employed in statistics and psychometrics, serving as a smoothed representation derived directly from empirical data. It is fundamentally an idealized model that illustrates the continuous distribution of a variable within a population. While raw data […]

BESD: Making Statistical Significance Visually Clear
Binomial Effect Size Display The Core Definition of BESD The Binomial Effect Size Display, commonly abbreviated as BESD, is a powerful and intuitive statistical method designed to translate the often abstract concept of a correlation coefficient (*r*) into a highly accessible measure of practical difference. At its core, the BESD provides a clear, visual representation […]
Multidimensional Scaling: Mapping the Mind’s Proximity
MULTIDIMENSIONAL SCALING (MDS) The Core Definition of Multidimensional Scaling Multidimensional Scaling, commonly abbreviated as MDS, is a powerful statistical technique primarily utilized for visualizing the level of similarity or dissimilarity between different objects. At its core, MDS is a data reduction and visualization method that takes input data detailing the “proximity” between pairs of items—whether […]

Tangent Screen: Mapping the Hidden Depths of Human Vision
The Tangent Screen (Campimetry) in Visual Field Assessment The Core Definition of the Tangent Screen The Tangent Screen, often referred to interchangeably with the term Perimetry, is a fundamental, non-automated diagnostic tool utilized in both ophthalmology and clinical Neuropsychology for mapping the central 30 degrees of the Visual Field. It is a critical method for […]

Dynamic Visual Displays: Decoding Human Perception
Dynamic Visual Displays in Cognitive Psychology and Data Interpretation The Core Definition of Dynamic Visual Displays Dynamic Visual Displays (DVDs) represent a sophisticated category of data visualization tools characterized by their capacity for real-time manipulation and interaction. At its core, a dynamic visual display is a highly interactive, graphical representation of complex datasets that allows […]
Cumulative Records: Tracking Behavior Over Time
The Cumulative Record (Cumulative Curve) in Psychology The Core Definition and Function The Cumulative Curve, more accurately termed the Cumulative Record within experimental psychology, is a specialized graphical representation used primarily in the study of operant conditioning. It provides an objective and continuous measure of behavior by plotting the total number of responses emitted by […]

DOT Figure: Visualize Complex Human Data Intuitions
DOT Figure: A Novel Data Visualization Tool Core Definition of DOT Figure The DOT Figure is an innovative data visualization tool specifically engineered to facilitate efficient and intuitive data exploration within large and complex datasets. At its essence, DOT Figure provides a clear, concise visual representation where each individual data point is rendered as a […]

Cumulative Response Curves: Mapping Your Behavioral Growth
Cumulative Response Curve: A Comprehensive Overview The Core Definition A Cumulative Response Curve (CRC) serves as a potent graphical representation in data analysis, illustrating the aggregate amount of a specific response as it relates to an evolving independent variable. This analytical tool essentially plots the running total of observed outcomes against incremental changes in a […]

Quantitative Modeling: Mapping Patterns in Human Behavior
CURVE FITTING Introduction to Curve Fitting Curve fitting is a fundamental mathematical and statistical technique employed across various scientific and engineering disciplines, including psychology, to identify the most appropriate mathematical function that describes the relationship between a set of observed data points. At its core, it involves finding a “best fit” line or curve that […]
The Anorthoscope: Visualizing Complex Mental Dimensions
The Anorthoscope: A Novel Approach to Multidimensional Visualization The Core Definition: Understanding the Anorthoscope The Anorthoscope, as conceptualized in recent research, represents a cutting-edge device specifically engineered to facilitate the simultaneous visualization of multiple object dimensions. At its essence, this innovative tool addresses a fundamental challenge in data interpretation: how to effectively display and comprehend […]

Contingency Tables: Decoding Patterns in Human Behavior
Contingency Table The Core Definition of Contingency Tables A contingency table, often referred to interchangeably as a cross-tabulation table or crosstab, is a fundamental analytical tool in statistics used to display and analyze the relationship between two or more categorical variables. At its most basic, it presents the frequency distribution of these variables in a […]

Auditory Display: Transforming Data into Meaningful Sound
Auditory Display: Conveying Information Through Sound The Core Definition of Auditory Display Auditory display, often interchangeably referred to as sonification or auditory mapping, represents a sophisticated technique dedicated to conveying information through the strategic use of sound. At its heart, this interdisciplinary field seeks to leverage the remarkable capabilities of the human auditory system to […]

T-Unit Analysis: Measuring the Complexity of Human Thought
T-Unit (Minimal Terminable Unit) The T-unit, an abbreviation for “minimal terminable unit,” stands as a fundamental concept in linguistics and psycholinguistics, serving as a crucial analytical tool for understanding and measuring syntactic complexity in both written and spoken discourse. Developed to provide a more consistent and theoretically sound measure of language proficiency than traditional sentence-based […]

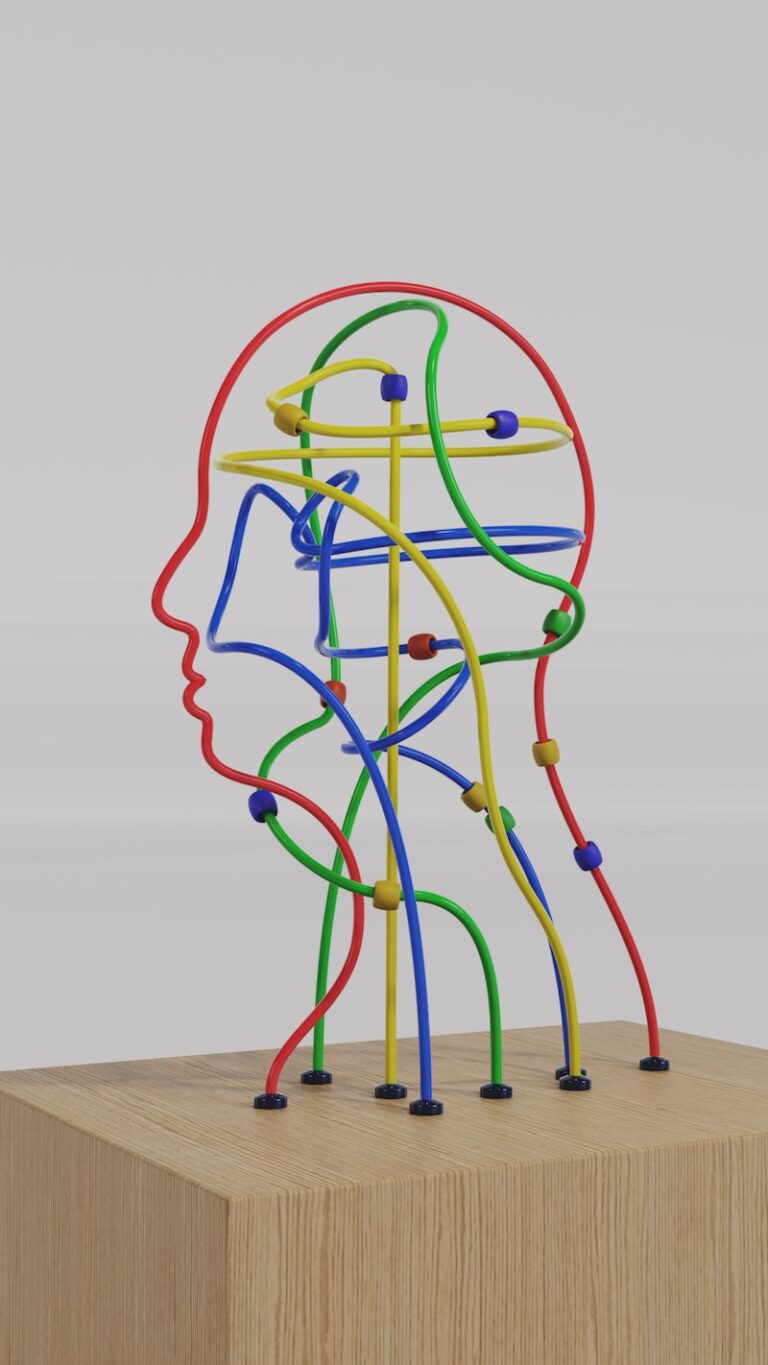
The Psychological Nexus: Unlocking Your Mental Core
NEXUS The Core Definition of the Psychological Nexus The concept of a psychological nexus refers to the intricate and often interdependent network of factors that converge to influence an individual’s mental state, emotional experiences, and behavioral patterns. It posits that psychological phenomena are rarely isolated occurrences but rather arise from the dynamic interplay of various […]

Data Visualization: Mapping the Landscape of Human Thought
Stem-and-Leaf Plot The Core Definition of Stem-and-Leaf Plots A stem-and-leaf plot is an innovative and highly intuitive graphical display used in descriptive statistics to organize and present quantitative data. At its most fundamental level, it serves as a hybrid visualization tool, combining the visual impact of a graph with the precision of a table, by […]

Tuning Curves: Decoding How Your Brain Processes Reality
Tuning Curve Introduction to Tuning Curves A tuning curve is a fundamental concept in neuroscience, serving as a graphical representation of the responsiveness of a neuron or a population of neurons to variations in a specific sensory stimulus or other relevant parameter. At its core, it provides a quantitative measure of a neuron’s selectivity, illustrating […]

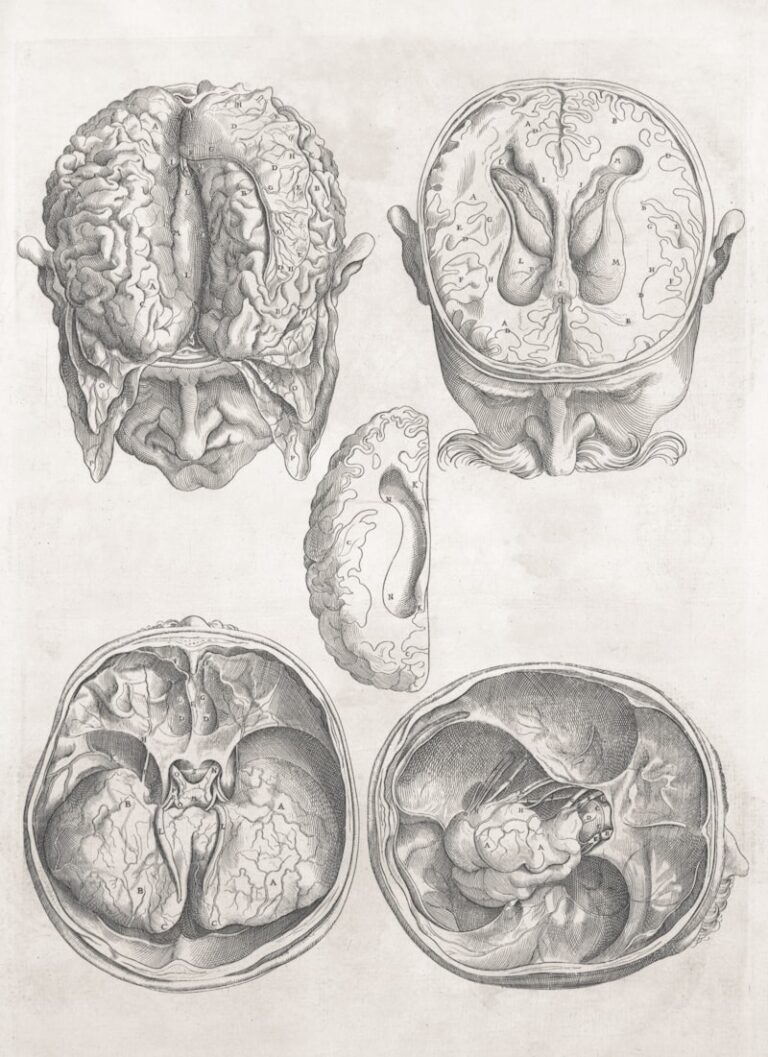
The Biogram: Your Unique Blueprint for Human Behavior
The Biogram: An Integrated Psychobiological Blueprint The Core Definition of a Biogram The term Biogram in psychology refers to an individual’s unique and integrated profile of biological predispositions and psychological patterns that collectively shape their temperament, personality, cognitive style, and overall behavioral tendencies. It represents a comprehensive blueprint, dynamically influenced by both inherent genetic and […]
LINK ANALYSIS
Introduction to Link Analysis Link analysis is a sophisticated methodological framework employed to meticulously examine and elucidate the intricate web of relationships and interconnections that exist between various entities, objects, or individuals within a given system. At its core, this approach transcends the mere observation of individual data points, focusing instead on the structural patterns […]
REPRESENTATIONAL INSIGHT
Representational Insight Within the vast landscape of cognitive psychology, the concept of Representational Insight stands as a pivotal mechanism for understanding complex problem-solving and creative thought. This profound phenomenon describes the sudden and often unexpected restructuring of an individual’s mental representation of a problem, leading to an immediate and clear path toward its solution. It […]
BAR GRAPH
Introduction to Bar Graphs: The Foundation of Categorical Data Visualization Bar graphs, which are frequently and interchangeably referred to as bar charts, represent one of the most fundamental, versatile, and enduring tools in the field of quantitative communication. Utilized extensively across a vast array of professional and academic disciplines—including empirical psychological research, business analytics, journalism, […]
SCATTER DIAGRAM, SCAVENGING BEHAVIOR
Introduction to Scavenging Behavior and Quantitative Analysis In the field of ethology and behavioral ecology, scavenging behavior represents a fundamental survival strategy characterized by the consumption of carrion or organic refuse that the consumer did not kill or harvest themselves. This opportunistic method of nutrient acquisition is observed across a remarkably diverse array of taxa, […]
BIPLOT
The Conceptual and Historical Genesis of the Biplot The biplot represents one of the most significant advancements in the field of multivariate statistics, providing a simultaneous visual representation of both the rows and columns of a data matrix. Originally introduced by K. Ruben Gabriel in 1971, the biplot was developed as a graphical tool to […]
SCATTERPLOT
Scatterplots are a powerful tool for data visualization and analysis. They are used to display relationships between two or more variables and can be used to identify correlations, trends, and patterns. Scatterplots are a popular choice for data analysis due to their ability to quickly reveal relationships and trends that may not be clear in […]
BAR DISPLAY
Foundations and Conceptual Framework of the Bar Display The bar display, frequently referred to as a bar chart or bar graph, constitutes one of the most fundamental and enduring tools in the arsenal of data visualization. At its core, a bar display is a graphical representation of data that utilizes rectangular bars with lengths proportional […]
EXPLORATORY DATA ANALYSIS
The Fundamental Principles and Scope of Exploratory Data Analysis Exploratory Data Analysis (EDA) represents a foundational pillar in the modern landscape of data science and psychological research. It is defined as an iterative and open-ended process designed to investigate datasets, summarize their primary characteristics, and uncover hidden structures without the constraints of a rigid hypothesis. […]
SCATTER
SCATTER PLOTS: A COMPREHENSIVE OVERVIEW Scatter plots, often simply termed “scatter diagrams” or “scattergrams,” represent one of the most fundamental and effective graphical techniques available for data visualization and preliminary statistical exploration. They provide an immediate, intuitive representation of the relationship, or lack thereof, between two distinct quantitative variables. These visualizations are indispensable tools across […]
BOX PLOT
Introduction and Definition of the Box Plot The box plot, also formally known as the box-and-whisker plot, stands as one of the most fundamental and versatile tools in the field of descriptive statistics. It offers a standardized, graphical method for displaying the distribution of a set of numerical data based on the five-number summary. Unlike […]
FREQUENCY POLYGON
Introduction and Definition The frequency polygon stands as a fundamental statistical tool specifically designed for the visual representation of data distribution. In the rigorous domain of quantitative analysis, transforming raw numerical data into an accessible graphical format is paramount, enabling researchers to quickly discern underlying patterns, trends, and the general shape of the dataset. A […]